5.10 – Psychrometric Charts and Spray Drying
5.10.0 – Learning Objectives
By the end of this section you should be able to:
- Understand what a psychrometric chart is and how it is used.
5.10.1 – Introduction
Psychrometric charts are useful tools for engineers as they allow for a concise, visual depiction of humidity, enthalpy, and temperature data on a single plot. This section introduces the psychrometric chart and how to gather important physical properties from it.
5.10.2 – Psychrometric charts and spray drying
A psychrometric (or humidity chart), properties of a gas or vapour are plotted which allows the visualization of the physical data.
The x-axis shows the dry-bulb temperature; this is equivalent to normal temperature.
The y-axis shows some form of humidity such as moisture or vapor pressure. The psychrometric chart in the text book will show moisture content.
On the slants, there are measurements of enthalpy which cross the chart.
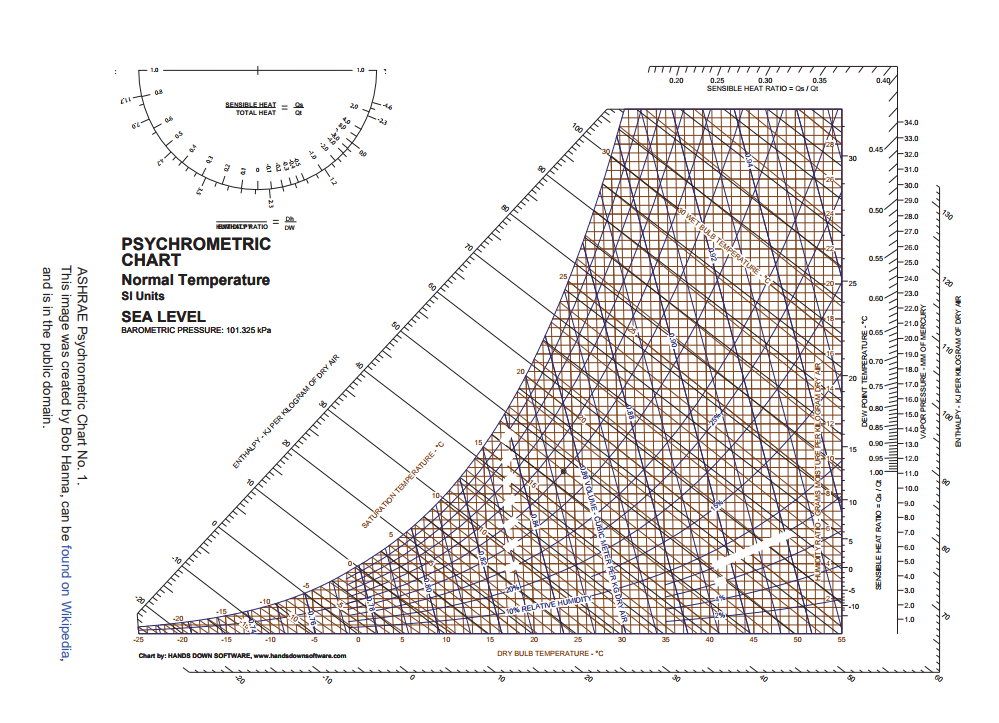
5.10.3 – Terminology of properties - found on the psychrometric chart
Relative Humidity: Lines curving upwards describe the relative humidity \(h_r = 100 \cdot \frac{\rho H_2O}{\dot{\rho}H_2O(T)}\). The topmost curve, or the upper boundary of the graph shows relative humidity at 100% otherwise known as the saturation curve.
Dew point \(T_{dp}\): The temperature at which humid air becomes saturated if cooled at constant pressure. The dew point is determined by selecting the humidity and moving horizontally to the saturation curve.
Humid Volume \(\hat{V}_{(H, \space dry \space air)}\): The volume of 1kg of dry air and any water vapour with the air. These are lines with a negative slope on the graph. To determine the humid volume of given mass of air you would the formula.
Wet-bulb temperature: Describes the temperature affected by air humidity. To find wet-bulb temperature at dry bulb temperature and a set relative humidity. Move leftwards horizontal until you reach the saturation curve and then evaluate wet-bulb temperature.
Specific enthalpy of saturated air: The horizontal lines show the enthalpy of saturated air. To determine the specific enthalpy of air at a certain temperature, follow the wet-bulb temperature out to the specific enthalpy curve.
In [ ]: